We divided wet experiment into two parts.
First, we experimented resistance part in A/D converter. Next, we experimented logic gate part in A/D converter.
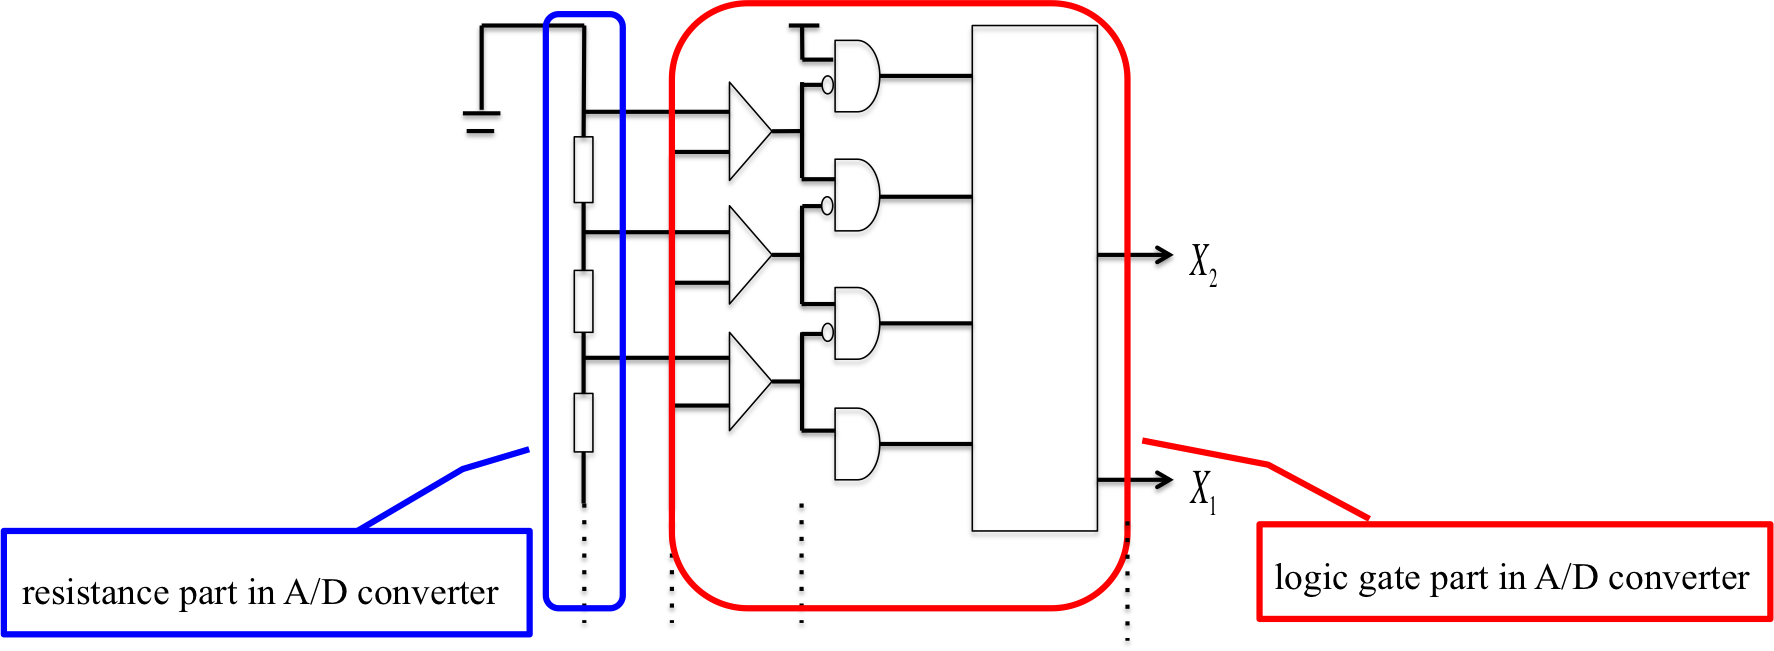
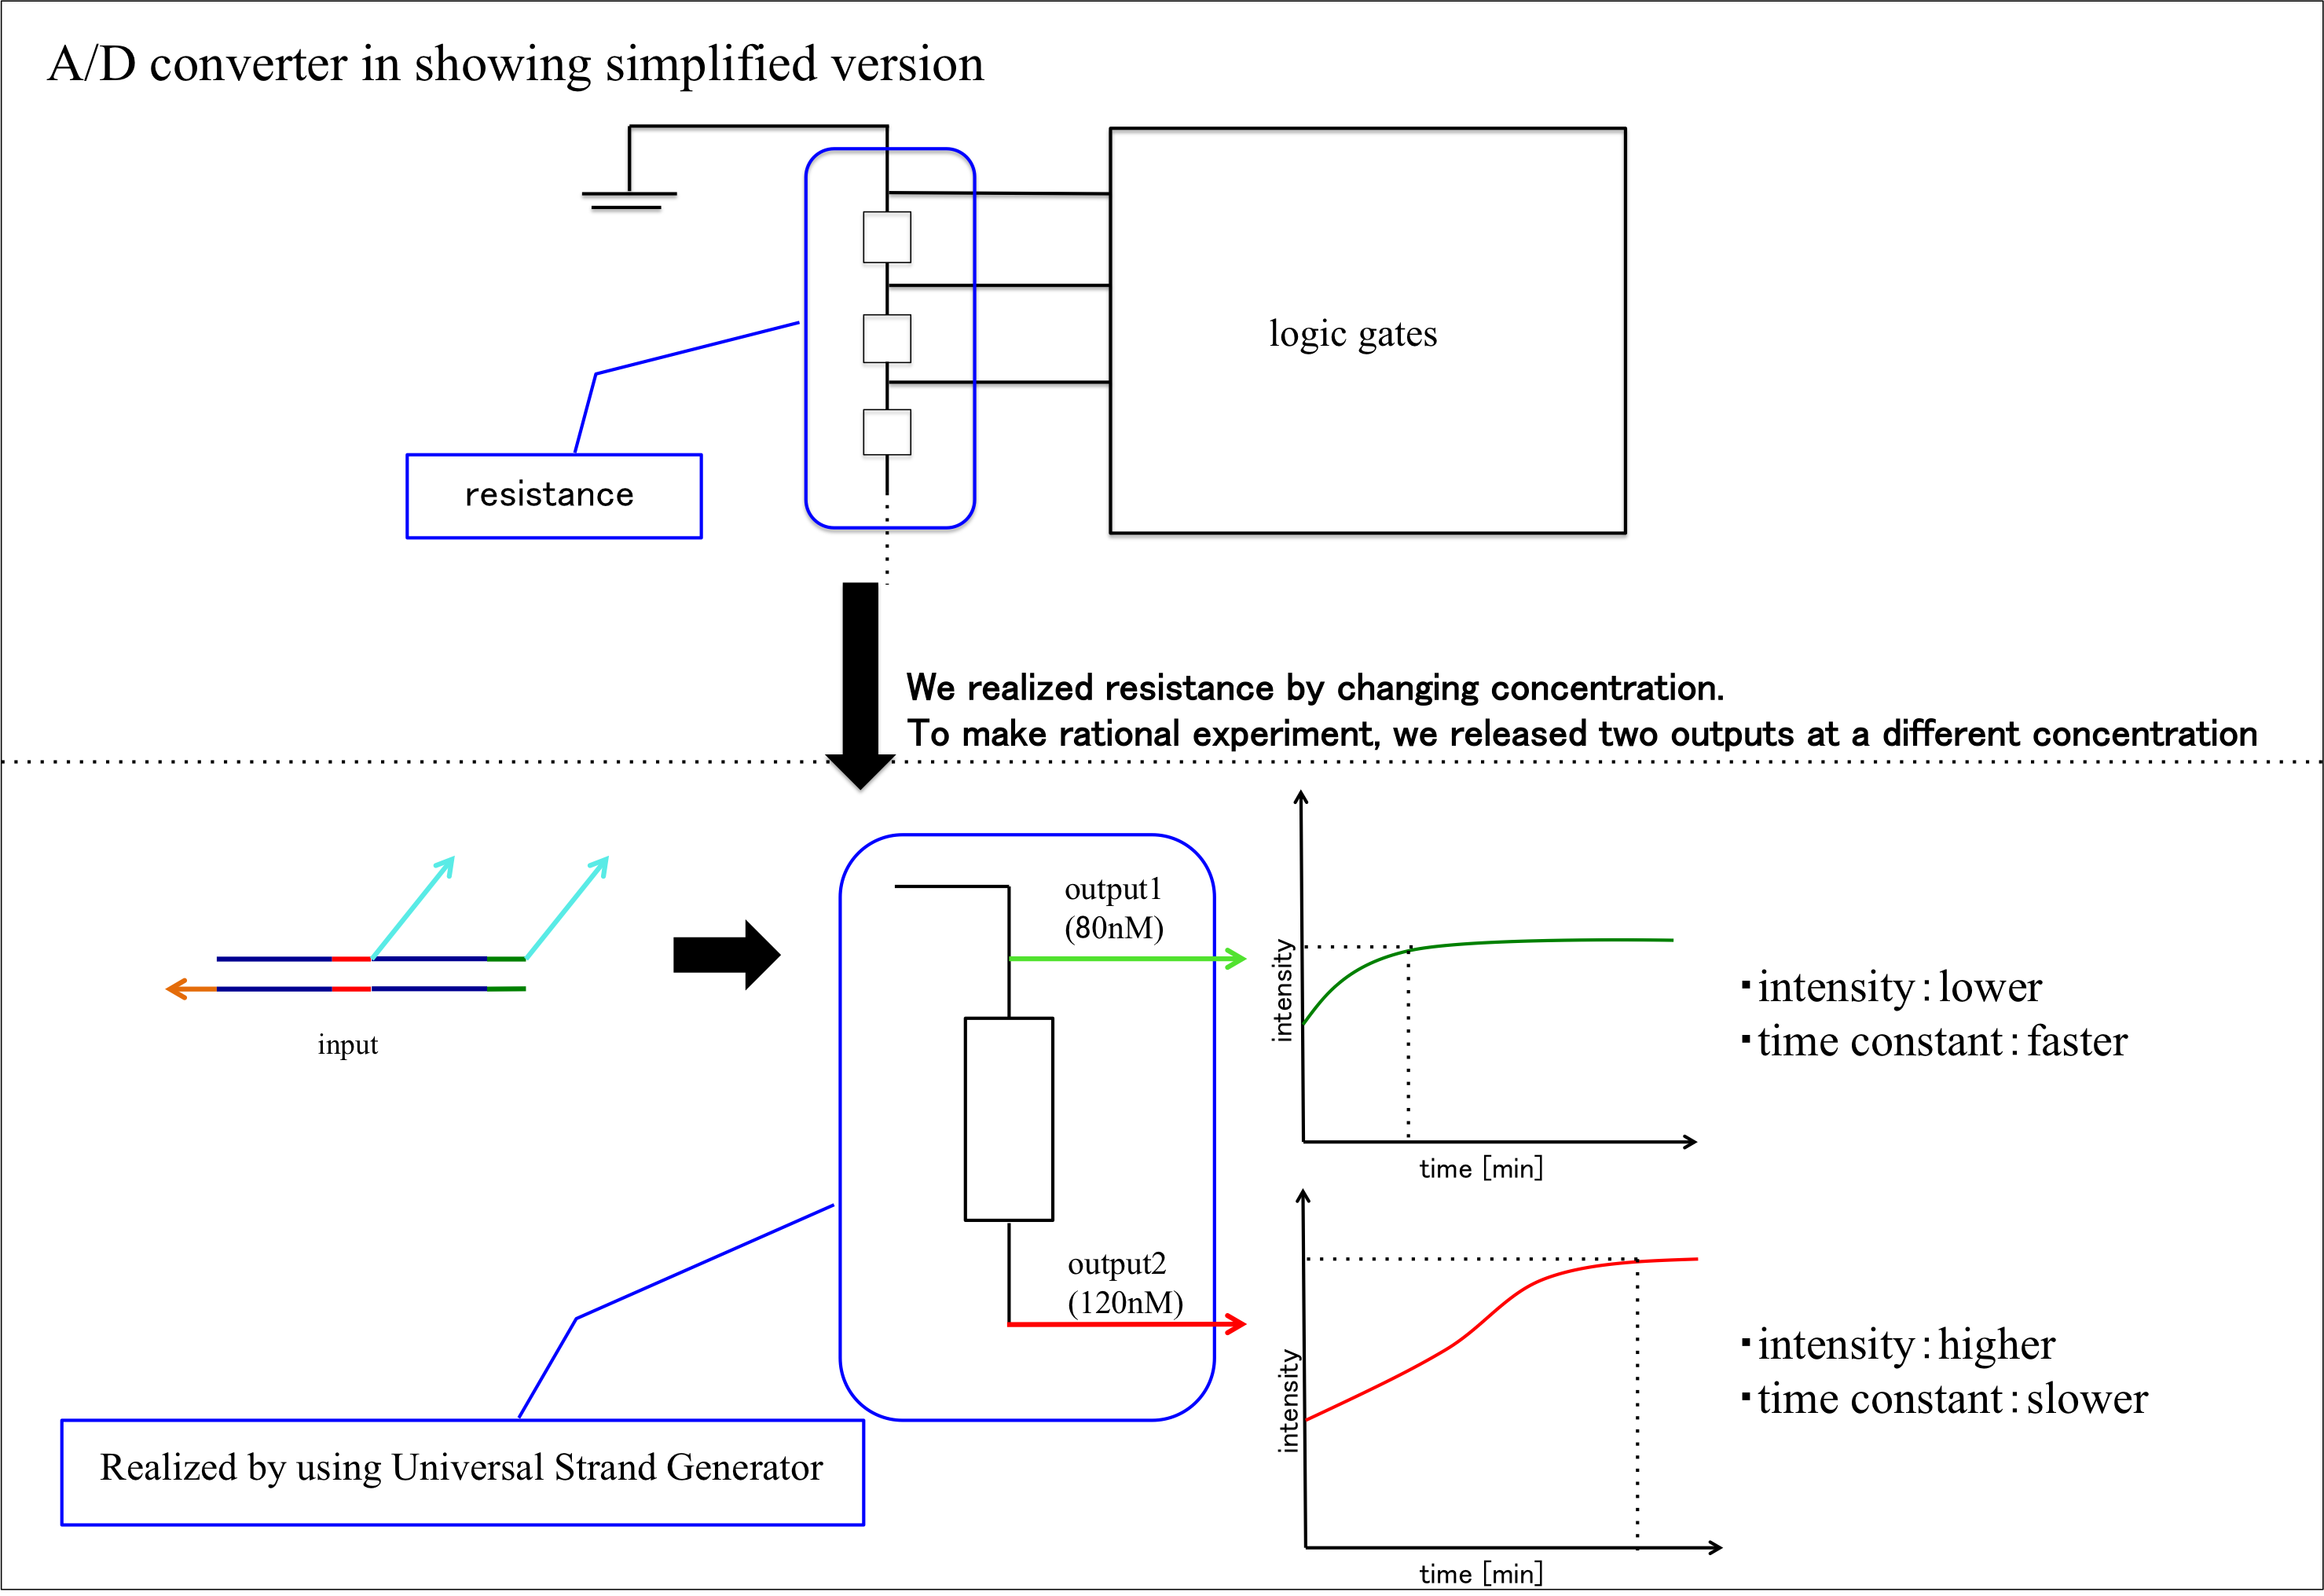
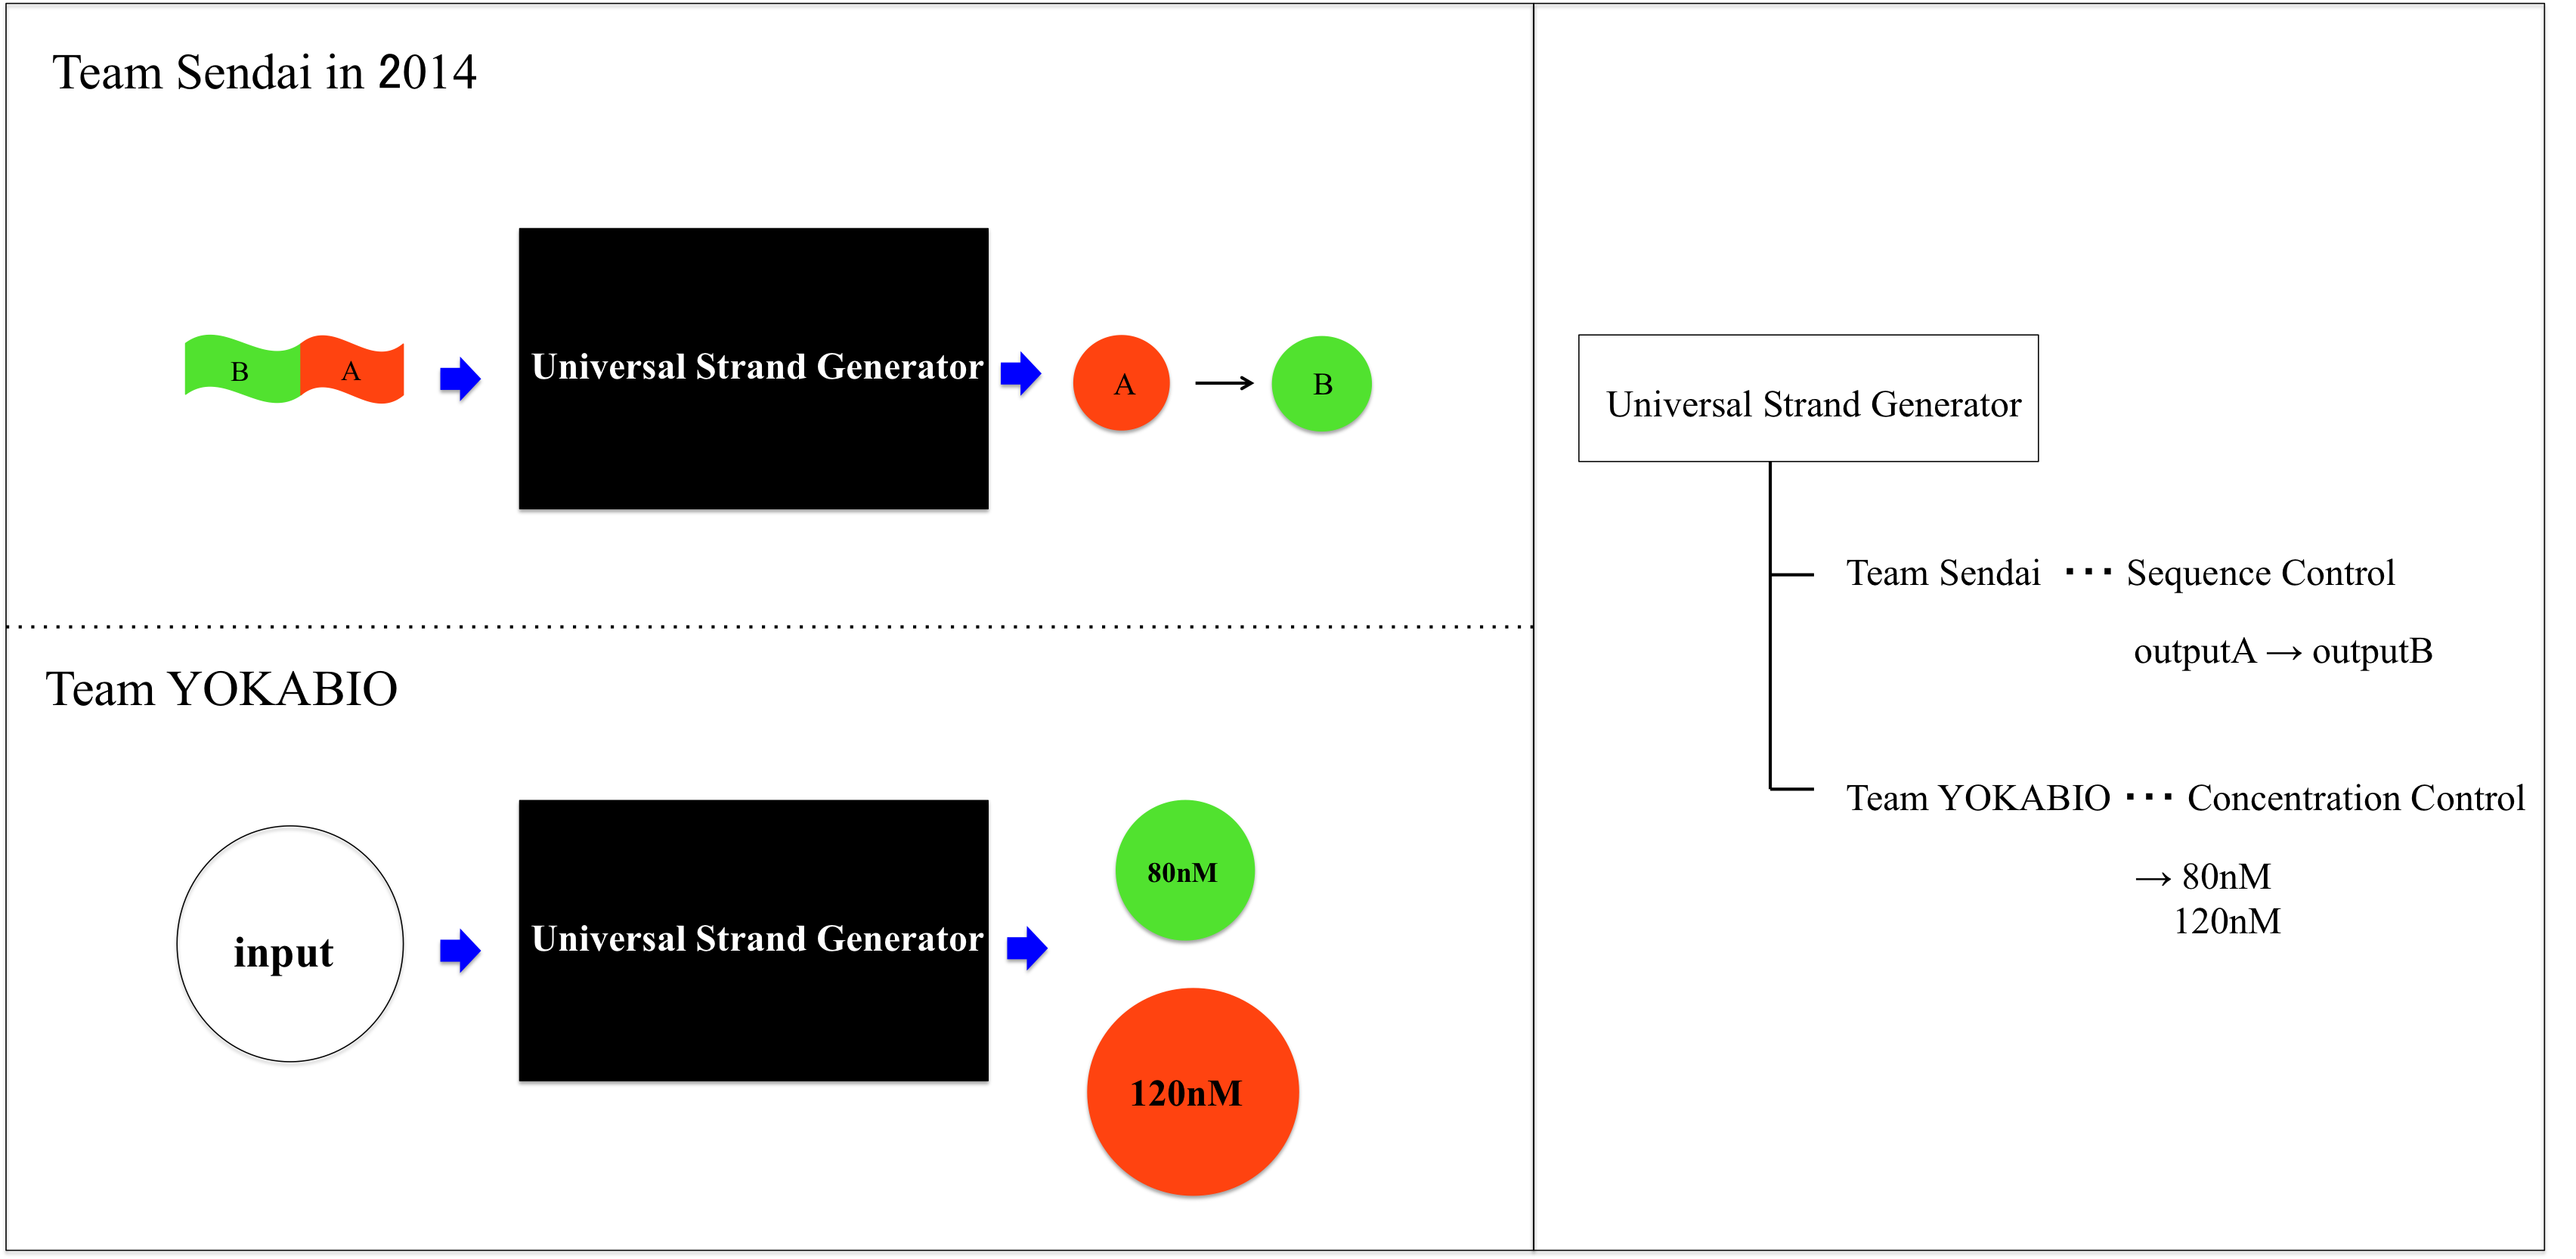
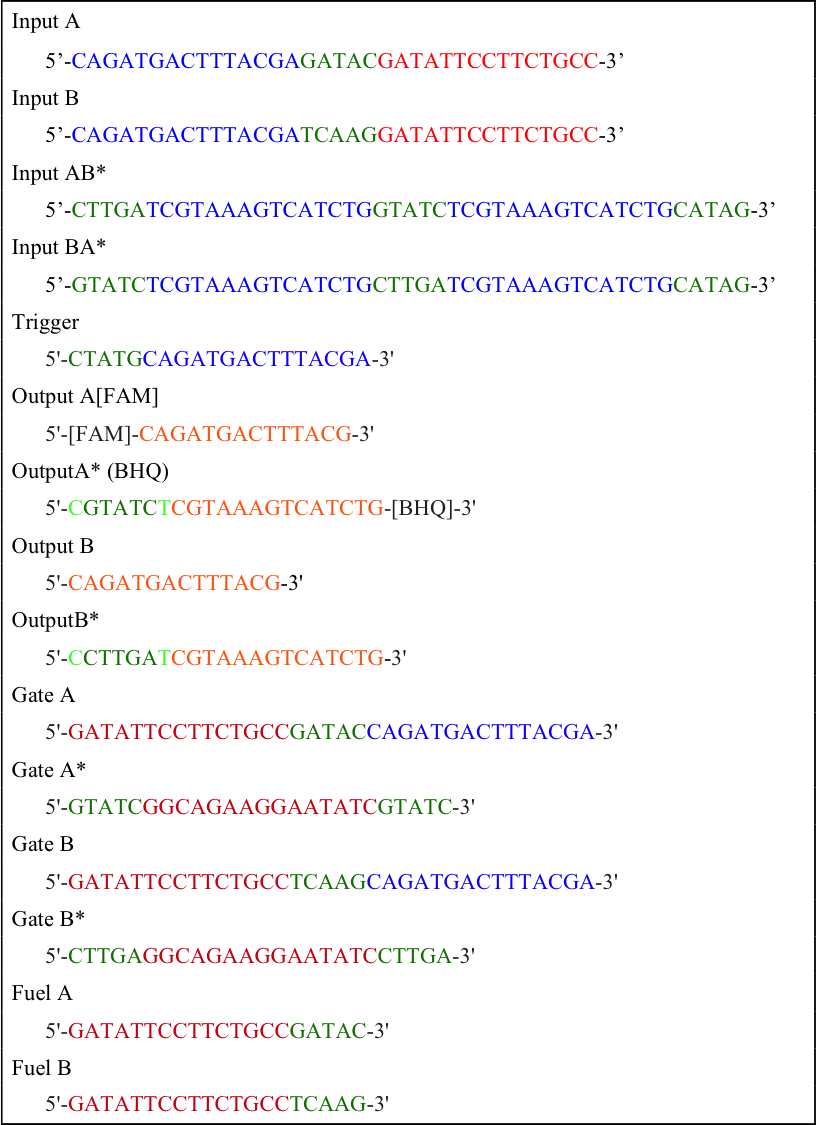
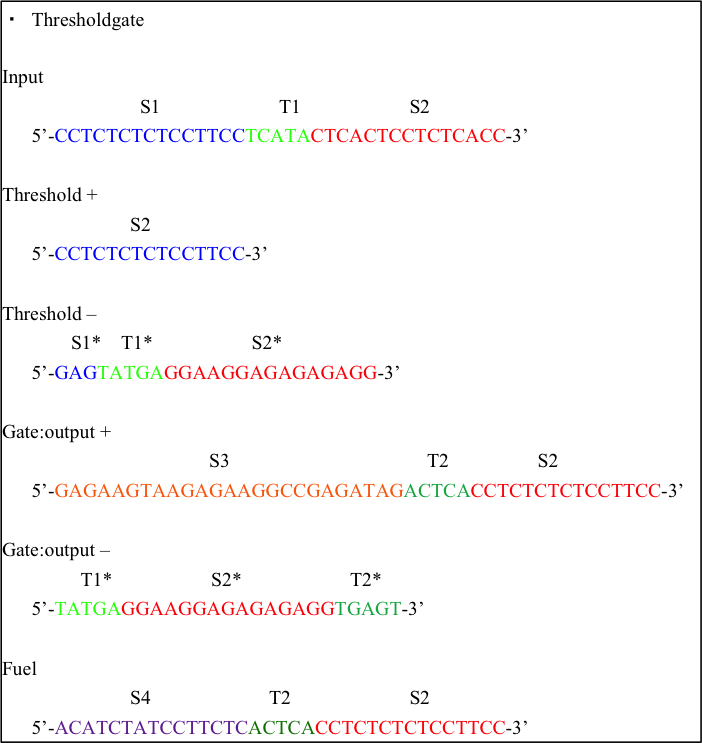
We realized resistance part in A/D converter by using Universal Strand Generator to release outputs at different concentration. Each DNA sequence is shown below.

If you want to see detail of reaction process and role of fluorescence molecule, please see the web site of Team Sendai in biomod2014. The URL is shown below.
http://teamsendai2014.github.io/protocol.html#Electrophoresis
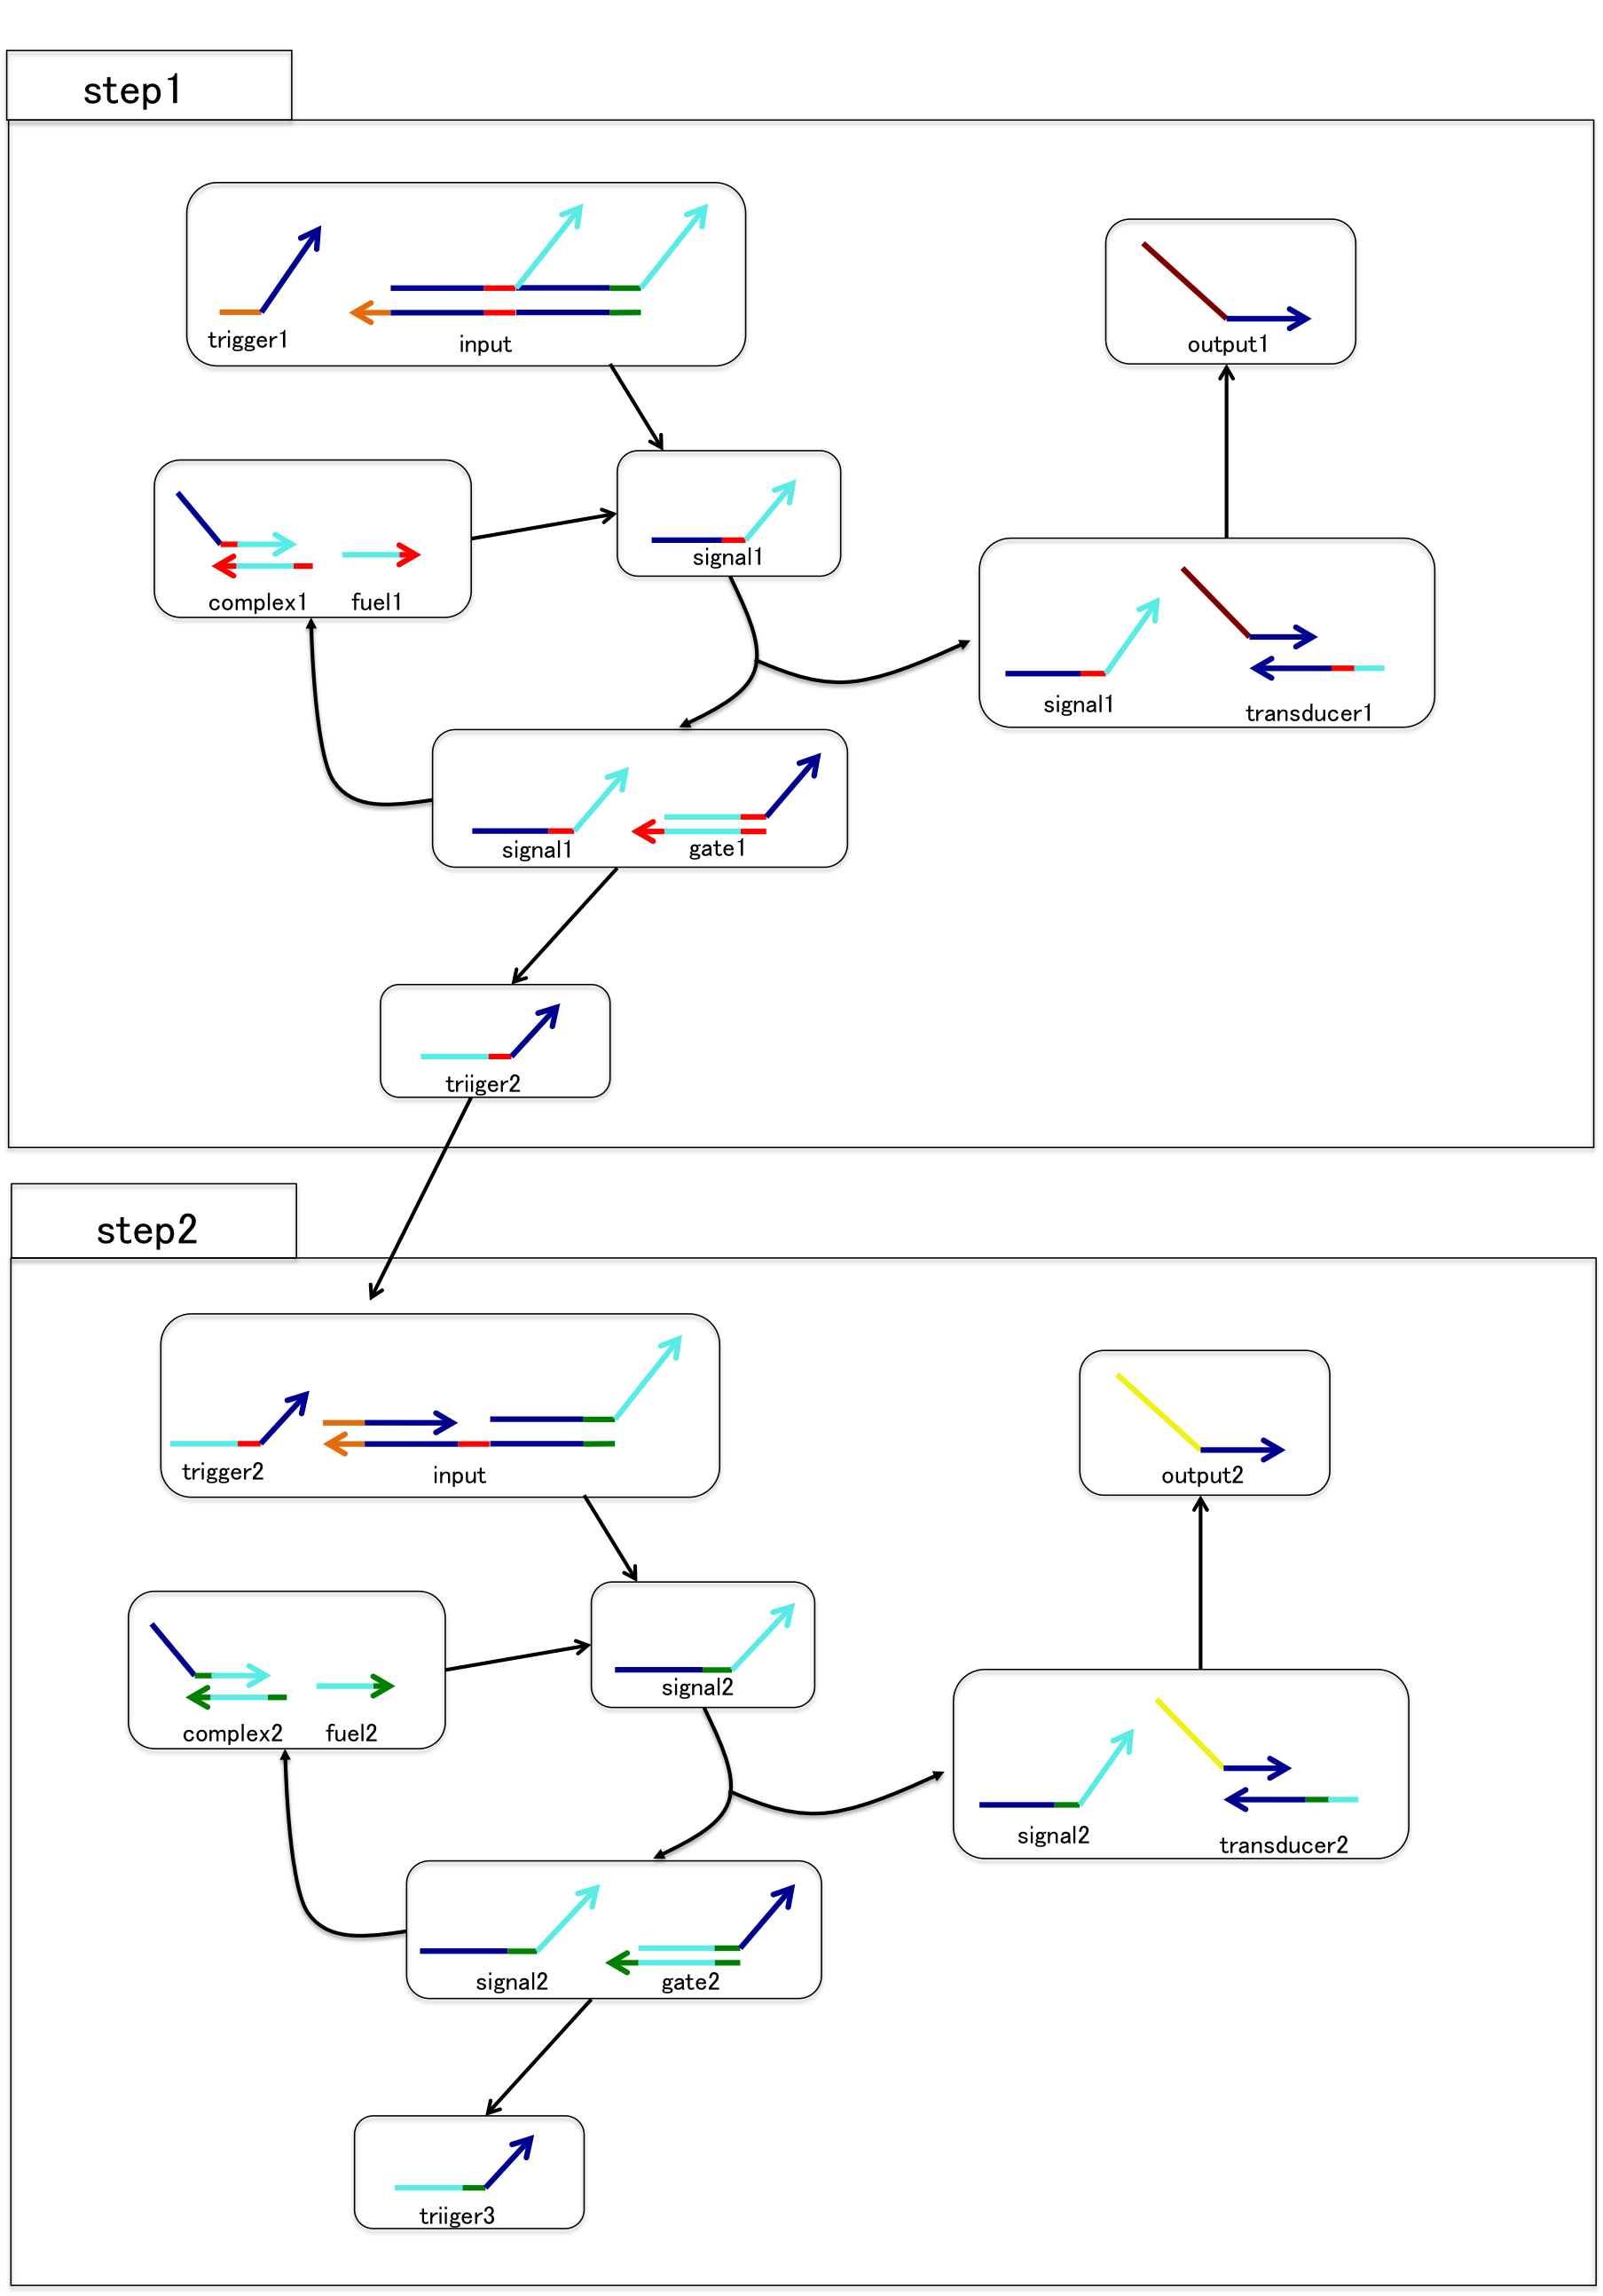
OutputA is released before releasing outputB. And we set transducerA concentration to 80nM to release outputA concentration of 80nM.
Following table shows the DNA we used in pattern1 of wet experiment.

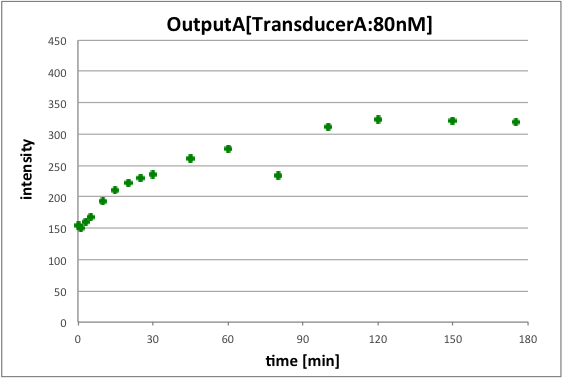
We put above DNA and measured fluorescence intensity of outputA by using spectrofluorometer(FP6200,JASCO).
Figure 6 shows the fluorescence intensity of outputA at wavelength 518nm. We could confirm that outputA is released in Figure6. Therefore we could see that step2’s reaction of Figure 4 is achieved.
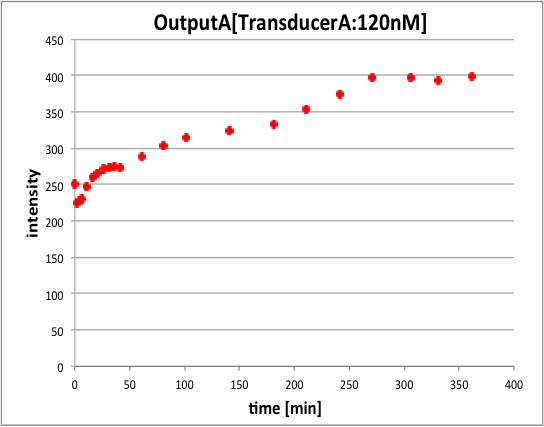
In conclusion, we could confirm that fluorescence intensity of pattern2 is higher than pattern. This is because we set that pattern1’s outputA concentration is 80nM and pattern2’s outputA is 120nM.
Moreover, we could confirm that pattern2 needs reaction time more than pattern1. This is because in pattern2, outputA in step2 is released after outputB in step1 is released. For this reason, we could generate two outputs having different concentration by using Universal Strand Generator.
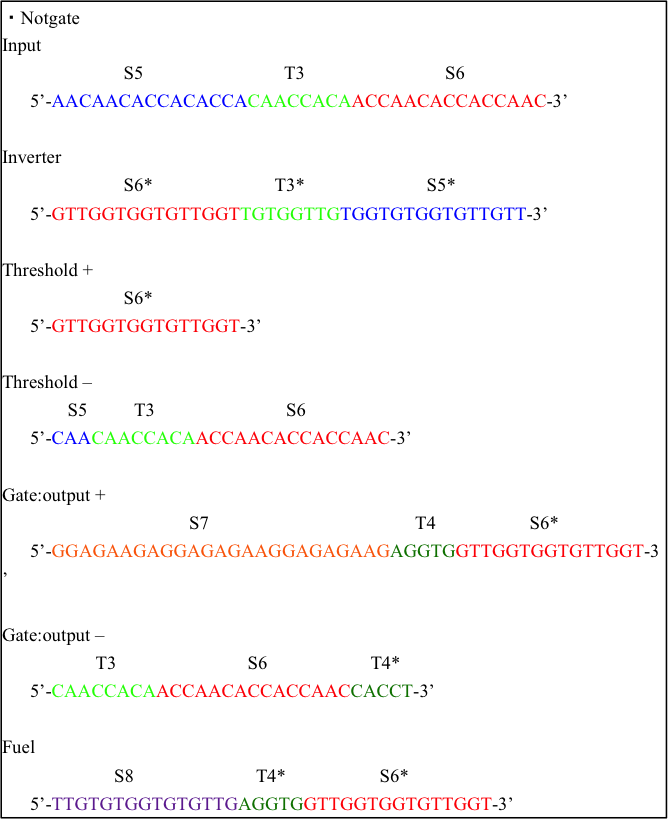
We experimented Threshold gate and NOT gate in A/D converter. To confirm whether output is released, we ran agarose gel electrophoresis.

We designed DNA sequences with NUPACK.
We considered minimum free energy of each reaction and designed DNA sequences for DNA strand displacement reaction easily.
We ordered all DNAs of liquid state and those concentrations are 100μM to Wako Pure Chemical Industries, Ltd. We diluted DNAs with following TE buffer and regulated the DNA concentration as Table8. Then, DNA are Stirring with vortex and centrifugal machine.


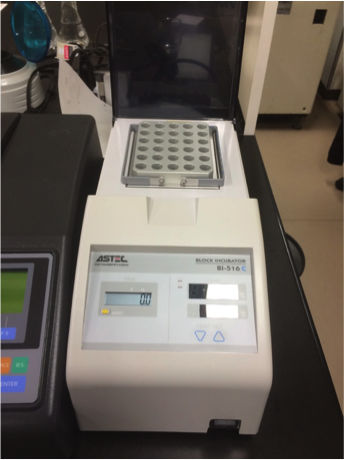
Figure 8: Incubator (ASTEC)
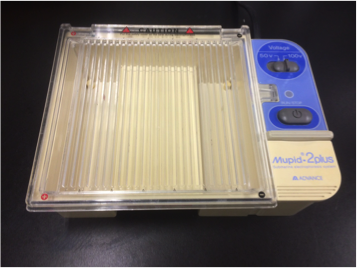
Figure 9: Electrophoresis chamber(Mupid)
Step 3: Annealing
Threshold and Gate:output were formed
by cooling with incubator.
(from 95 to 20℃, -2℃/min)
Step 4: Making 5% agarose gel
We added agarose(5mg) and TBE buffer(95ml)
and heated them in the microwave oven until
agarose and TBE buffer completely dissolved.
After the agarose had cooled, poured the agarose
in the holder which was set the comb.Agarose hardened completely, removed
the comb and moved agarose to chamber.
We added TBE buffer to the chamber.

We put all DNA into the tube and mixed them at normal temperature.
We added mixed DNA (5μl) and 6× Low Molecular Weight DNA Ladder(1μl). Next, we applied mixed solution (6μl) to each gel-well, and ran electrophoretic device at 100V, for 30mins.
When we finished electrophoresis, we moved gel to the container that is added GelRed (1μl). We shook the container with seesaw shaker. Putting elements in each lane as follow, and we verified output’s difference whether the input was high or low.
1Lane Input(high),Threshold
2Lane Input(low), Threshold
3Lane Input(high), Threshold, Gate:output, Fuel
4Lane Input(low), Threshold, Gate:output, Fuel
5Lane Input(high)
6Lane Input(low)
7Lane Input(high), Inverter, Threshold, Gate:output, Fuel
8Lane Input(low), Inverter, Threshold, Gate:output, Fuel
Unfortunately, we could not obtained the desired results with electrophoresis in which some experimental conditions might not be adequate although the basic experimental conditions had determined in preliminary experiments.
・Team Sendai(2014) Materials and Methods. Available
at : http://teamsendai2014.github.io/protocol.html (Accessed 14 October 2015 )